The future of #job and #matrimony sites in India looks dull. All these would lose out to love marriages and professional networking.
The job market is filled with people who love to help like Oleg Vishnepolsky and many other kind people on professional networking sites like LinkedIn
So, unless these companies identify a scaling up / branching out model , it will be a tough run for them in my opinion.
Branching out is important for any business that needs to sustain and diversify its revenue opportunities. The Indian online market mostly have big players in Job, matrimony while Indian grown Zoho Corporation is a global company.
Companies diversify through ideas coming from their R&D team, blind investment, External startup pitches etc. Indian companies mostly do not have R&D team in their company. Rather they try to blindly invest or branch out based on the decision of the “key” people in the management.
Apple spends about $8 billion a year on R&D, a lower portion of revenues as Apple earns so much money. Amazon invest about $10 billion a year – which puts this investment at about 10 percent of revenues. A reasonable benchmark for R&D companies for tech companies seems to be about 10 percent of revenues
source: https://www.insidehighered.com/blogs/technology-and-learning/how-much-should-we-be-spending-learning-rd
The sad state of Indian patents. Lets hope that more patents comes out of India and more companies invest on R&D. Another important negative aspect is Indians do not want to give credit to others which hinders others from working/putting efforts.
Around 2.68 million patent applications were filed worldwide in 2014, up 4.5% from 2013 (figure 1). Driving that strong growth were filings in China, which received 103,000 of the 116,100 additional filings and accounted for 89% of total growth, whereas the United States of America (US) contributed 6% of total growth.The 4.5% growth in filings in 2014 is lower than the growth rate in each of the previous four years, which varied between 7% and 10%
China received more applications than Japan and the US combined
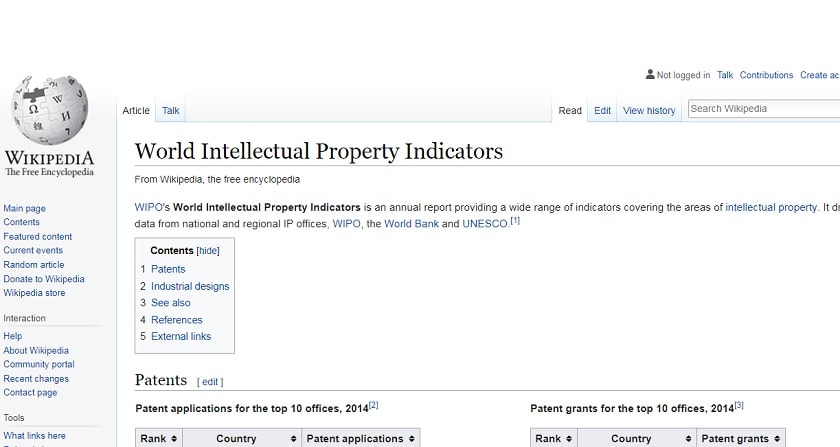
Patents (Source: Wikipedia)
Patent grants for the top 10 offices, 2014
| Rank | Country | Patent grants |
|---|---|---|
| 1 | 300,678 | |
| 2 | 233,228 | |
| 3 | 227,142 | |
| 4 | 129,786 | |
| 5 | European Patent Office | 64,608 |
| 6 | 33,950 | |
| 7 | 23,749 | |
| 8 | 19,304 | |
| 9 | 15,030 | |
| 10 | 11,889 |
Patent applications for the top 10 offices, 2014
|
P |
Patent applications per million population for the top 10 origins, 2012
|
Patent applications per GDP for the top 10 origins, 2012
|
Industrial designs
Application design counts for the top 10 offices, 2012
|
Application design counts for the top 10 origins, 2012
|
Application design counts per million population for the top 10 origins, 2012
| Rank | Country | Application design count per million population |
|---|---|---|
| 1 | 1,217 | |
| 2 | 797 | |
| 3 | 540 | |
| 4 | 507 | |
| 5 | 476 | |
| 6 | 470 | |
| 7 | 447 | |
| 8 | 348 | |
| 9 | 333 | |
| 10 | 295 |
Industrial design registrations in force for the top 10 offices, 2012
| Rank | Country | Registrations in force |
|---|---|---|
| 1 | 1,132,132 | |
| 2 | 269,501 | |
| 3 | 260,107 | |
| 4 | 248,822 | |
| 5 | European Union‘s OHIM | 167,145 |
| 6 | 72,552 | |
| 7 | 57,089 | |
| 8 | 46,573 | |
| 9 | 46,194 | |
| 10 | 43,072 |

